Summary
Here, we developed a web serve called Tumor online Prognostic analyses Platform (ToPP), which collected multi-omics (mutation, CAN, gene fusion, mRNA, miRNA, lncRNA, protein and methylation) and clinical data from 56 types of tumors datasets from The Cancer Genome Atlas (TCGA) as The Cancer Genome Atlas (TCGA), International Cancer Genome Consortium (ICGC) and the Clinical Proteomic Tumor Analysis Consortium (CPTAC)project.
ToPP provide a user-friendly web interface to reduce user barriers, as well as the customizable high resolution charts. In addition, except to conventional univariate or multivariate analysis, it also provides subgroup survival analysis, prognostic modeling, pan-caner survival analysis, and allows users to upload their own data for prognostic analysis.
ToPP aims to provide more convenient and reliable prognostic analysis services for tumor researchers no login requirement.
Browser compatibility
| OS | Version | Chrome | Firefox | Microsoft Edge | Safari |
| Linux | CentOS 7 | 87.0.4280.88 | 60.3 | n/a | n/a |
| MacOS | Mojave 10.14.6 | 87.0.4280.67 | 72.0.2 | n/a | 14.0.1 |
| Windows | 10 | 86.0.4240.198 | 82.0.3 | 44.18362.449.0 | n/a |
Contact us
If any question about the ToPP, please contact us: ouyangjian12@163.com
Update news:
- Version 1.2 : Time 2020-9-30,Collected multi-omics data and clinical data of 41 tumors in ICGC.
- Version 1.1 : Time 2020-5-1,Collected the MS proteomics data in Breast invasive carcinoma (BRCA), Colon adenocarcinoma (COAD), Ovarian serous cystadenocarcinoma (OV) and Rectum adenocarcinoma (READ) from CPTAC.
- Version 1.0 : Time 2019-12-31,construct the basic analysis tools of the webserver and add the multi-omics data and clinical data of 33 tumors in TCGA.
Univariate analysis
Univariate analysis was performed by log-rank test.Kaplan-Meier(KM) survival curves [1] will draw by the divided groups, the hazard ratio and the 95% confidence interval information will also be included in the survival plot.
Since the researchers may also be interested in the differential expression between tumor tissue and the paracancerous tissue, ToPP also provides boxplot for the two groups and wilcoxon test was performed test if there is significant difference between the two groups.
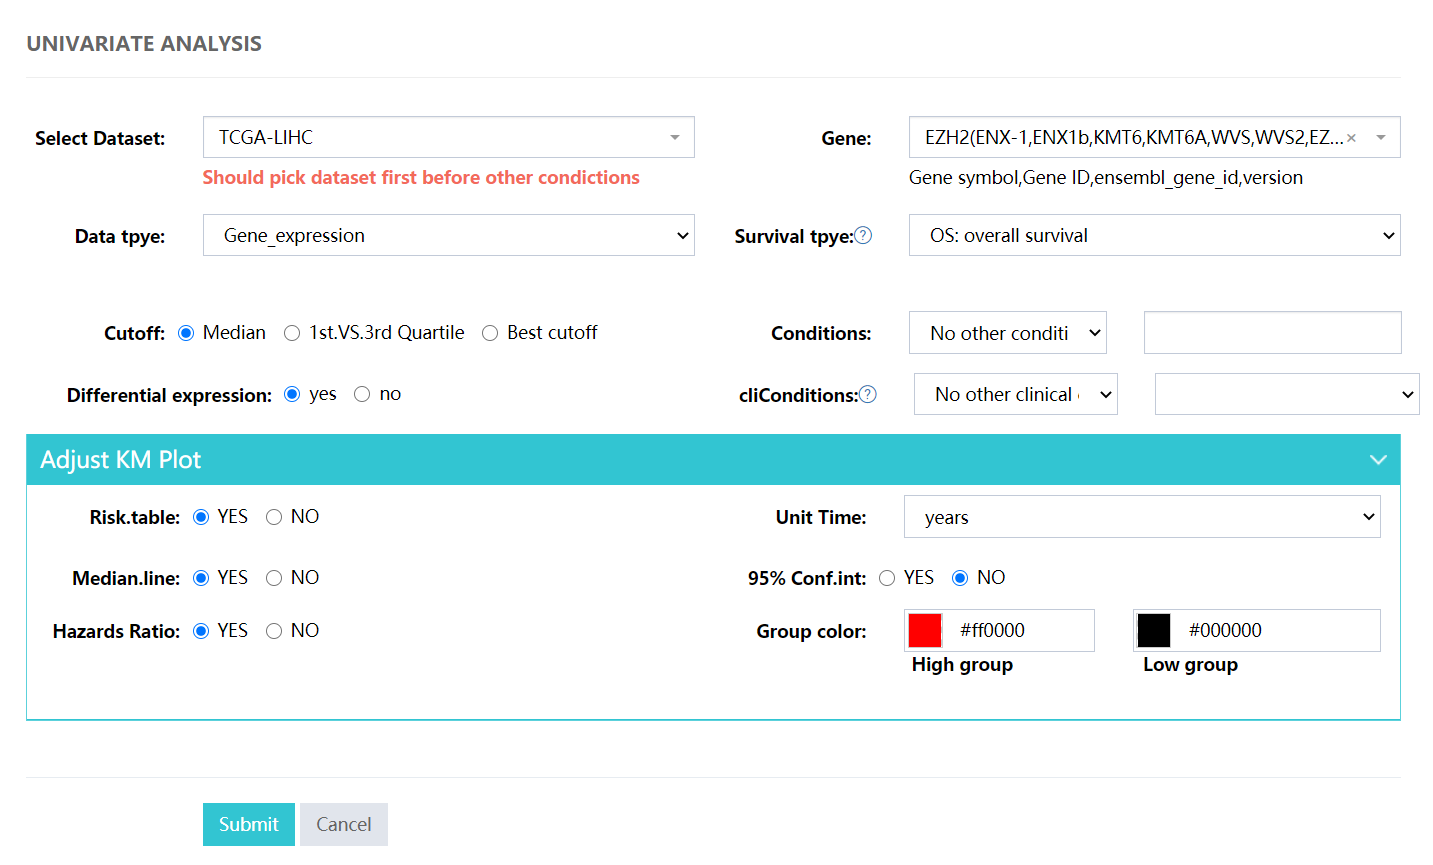
Parameters
Data selection
- Select Dataset: Select the dataset, there are a total of 33 datasets here. See the Supplemental table for more information.
- Gene: Input a Gene symbol,Gene ID or ensembl_gene_id with fuzzy query.
- Data tpye: Select a certain omics data. Each dataset selected above may contain 8 types of omics data (Gene expression,lncRNA expression,miRNA expression,Somatic mutation,Protein expression,Methylation,Copy number variation,Gene fusion).
- Survival tpye: There are a total of five survival types to choose from: OS: overall survival, PFI: progression-free interval, DSS:disease-specific survival,DFI:disease-free interval and RFS:Relapse Free Survival.
- Cutoff: For continuous variables such gene or protein expression, variable will be divided into two groups by the median, quantile or the ‘best-cut’ value. Here, we calculated all the log-rank p value by the cut of each sample and keep at least 10% of samples for each group and the cut with the lowest p value was represented as the ‘best-cut’. While for categorical variable such mutation, CNA or gene fusion, variable will be divided into groups by the classification.
- Conditions: Subgroup screening based on omics data,such as Somatic mutation,Methylation,Copy number variation.
- cliConditions: Subgroup screening based on clinical data,such as gender,race,tumor stage,or disease-specific clinical features such as HER2+ in breast cancer.
- Differential expression: Whether to perform differential expression analysis between cancer and adjacent cancer.
Draw designs
- Risk.table: Draw risktable under the K-M curve.
- Unit Time: Choose a unit of time for survival such as years,months and days.
- Median.line: Plot the survival rate for the median survival time
- 95% Conf.int: Show the 95% confidence interval of the K-M curve.
- Hazards Ratio: Show the Hazards Ratio between the two groups.
- Group color: Select the different color for the two groups.
Result
Typical univariate analysis, for subgroup analysis please choose the Conditions or cliConditions selector.
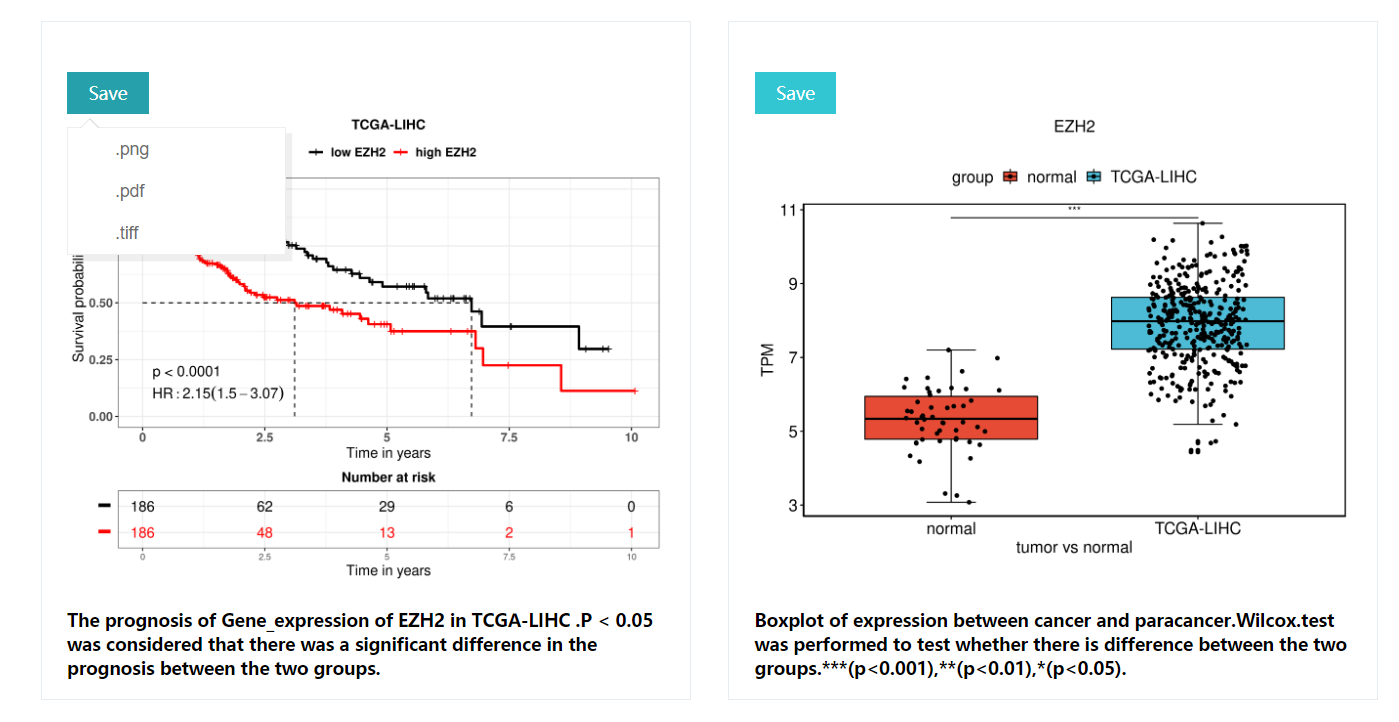
KM curves: includeing p-values for the lograng test (p<0.05 was considered to be significantly different between the two groups),Hazards Ratio,risk table, description of the results, etc.
Boxplot :The wilcox test was used to detect whether the two groups were significantly different in terms of expression, *** for p<0.001,** for p<0.01,* for p<0.05,NA for no significant difference between the two groups Difference. All resulting images are downloadable including .pdf, .png, .tiff formats with 300 DPI.
Multivariate analyses
Multivariate analysis was performed by cox regression analyses (or Cox proportional hazards model) [2].When ToPP performs multivariate analysis, it will not only give the p value of HR and logrank test for each gene in multivariate analysis, but also calculate the p value of HR and logrank test for each gene as a separate prognostic factor. So that, user can determine whether this gene is an independent prognostic factor.
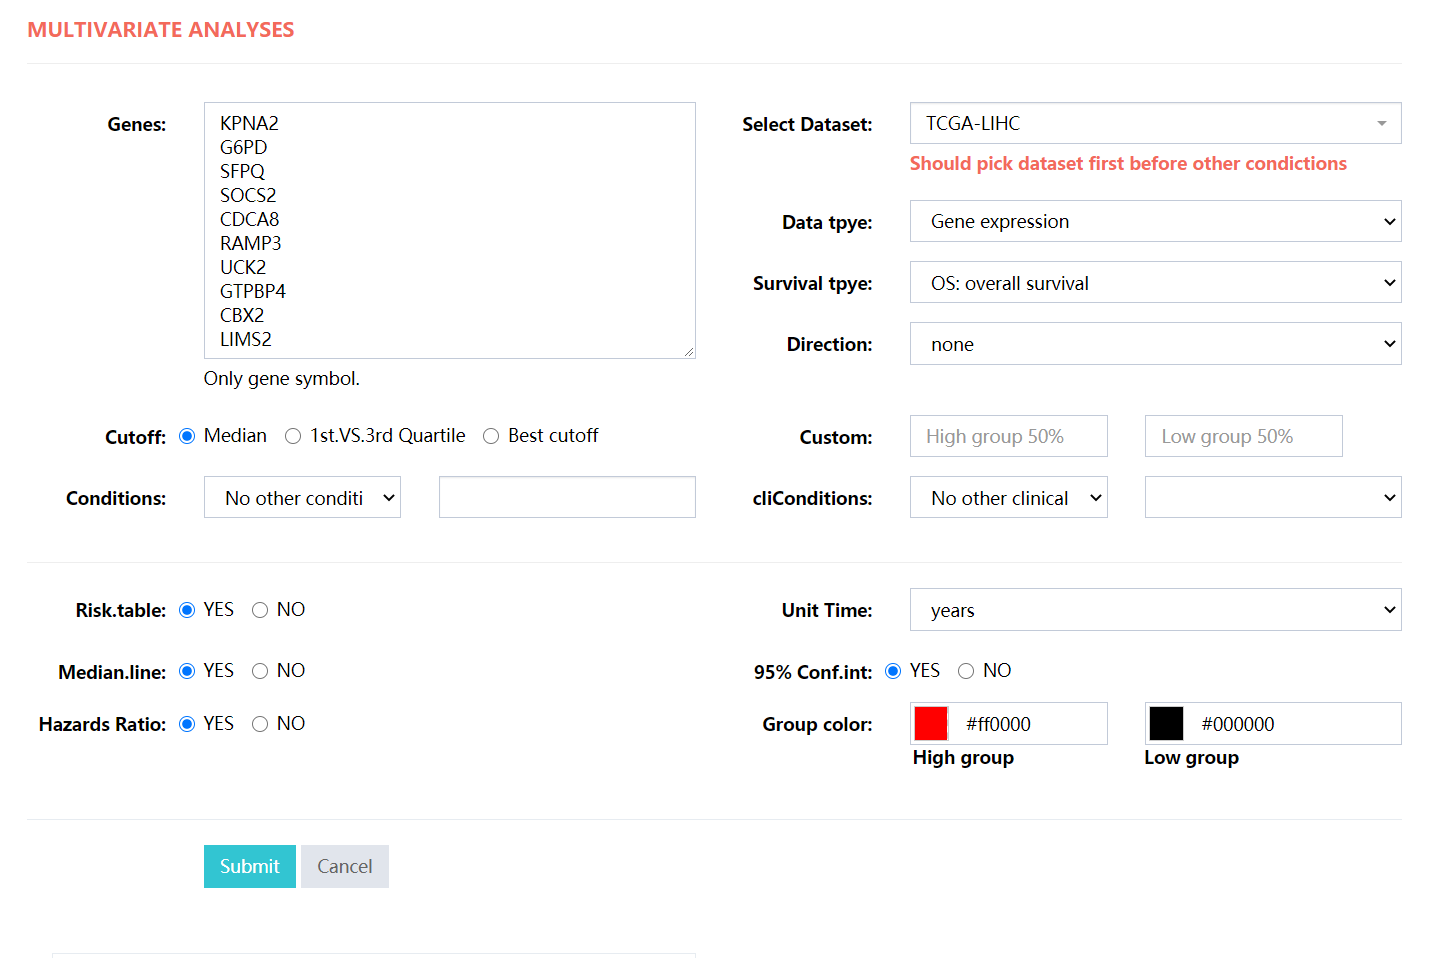
Parameters
- Genes: Input a gene list with Gene symbol only.
- Select Dataset: Select the dataset, there are a total of 33 datasets here. See the attached table for more information.
- Data tpye: Select a certain omics data. Each dataset selected above may contain 8 types of omics data (Gene expression,lncRNA expression,miRNA expression,Somatic mutation,Protein expression,Methylation,Copy number variation,Gene fusion).
- Survival tpye: There are a total of five survival types to choose from: OS: overall survival, PFI: progression-free interval, DSS:disease-specific survival,DFI:disease-free interval and RFS:Relapse Free Survival.
- Cutoff: For continuous variables such gene or protein expression, variable will be divided into two groups by the median, quantile or the ‘best-cut’ value. Here, we calculated all the log-rank p value by the cut of each sample and keep at least 10% of samples for each group and the cut with the lowest p value was represented as the ‘best-cut’. While for categorical variable such mutation, CNA or gene fusion, variable will be divided into groups by the classification.
- Conditions: Subgroup screening based on omics data,such as Somatic mutation,Methylation,Copy number variation.
- cliConditions: Subgroup screening based on clinical data,such as gender,race,tumor stage,or disease-specific clinical features such as HER2+ in breast cancer.
- Differential expression: Whether to perform differential expression analysis between cancer and adjacent cancer.
- Draw designs: View a description of the parameters in the Univariate analysis.
Result
Typical multivariate analyses, for subgroup analysis please choose the Conditions or cliConditions selector.
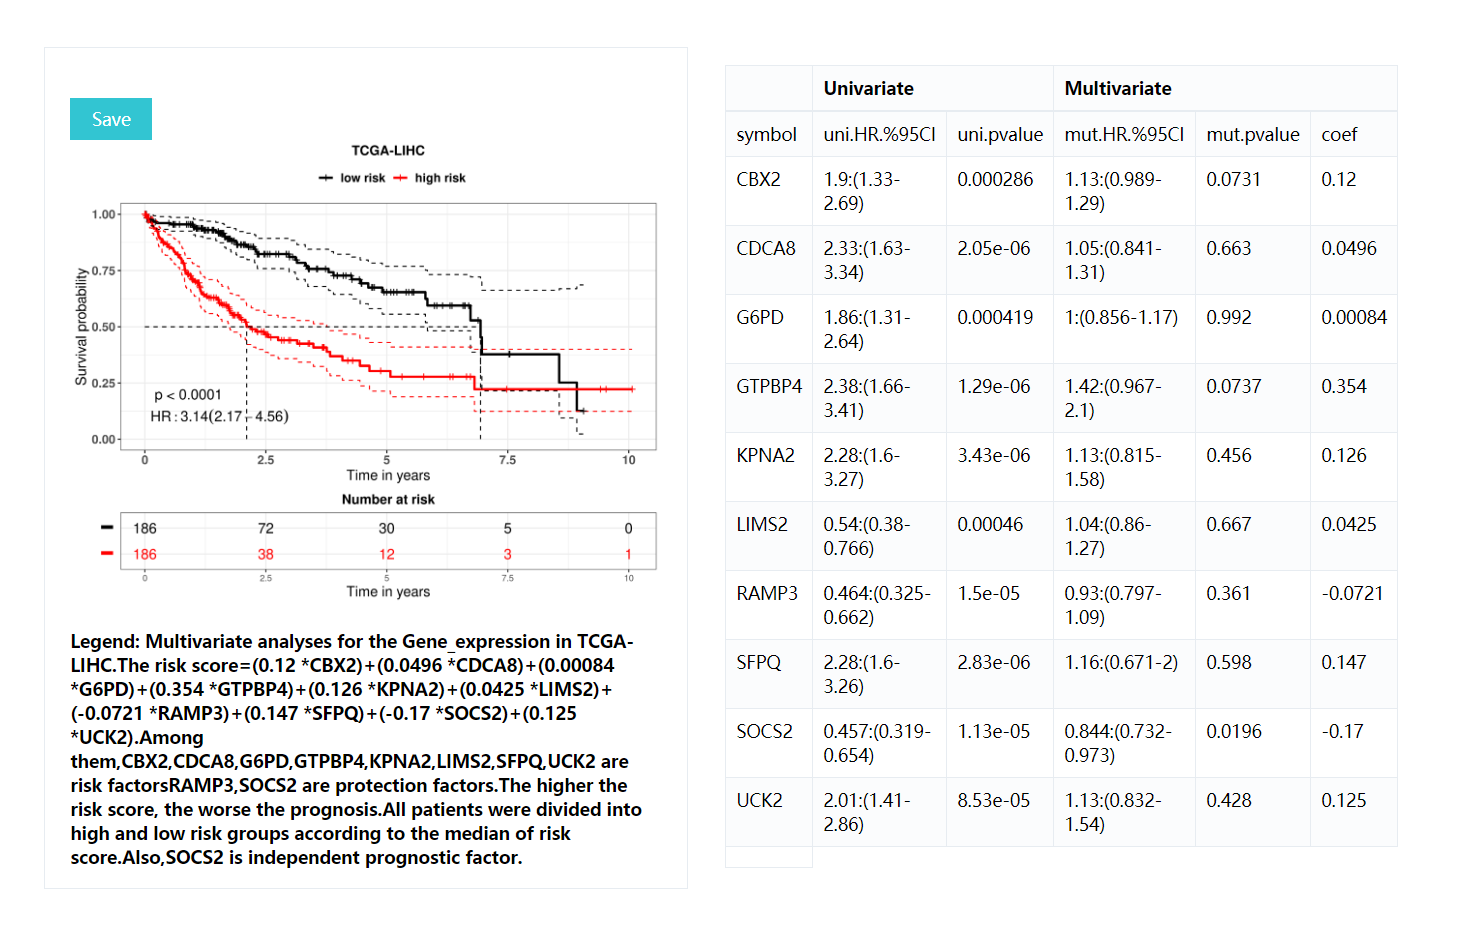
KM curves: includeing p-values for the lograng test (p<0.05 was considered to be significantly different between the two groups),Hazards Ratio,risk table, description of the results, etc also,it will demonstrate the formula for calculating risk score.All resulting images are downloadable including .pdf, .png, .tiff formats with 300 DPI.
Result table:contains HR values for each gene in univariate analysis and multifactor analyses, p-values of logrank test and coefficients in multifactor analysis
Prognostic model
When in constructing a prognostic model, firstly, we fit a naive Cox model include all covariates. While in the real world data we should removing redundant or irrelevant variables from the model which describes the data by reducing variance on the expense of bias to make model more robust. Interaction between covariates and time-dependent covariates should also be considered in the modeling process [3]. Here we select stepwise selection for variables selection, stepwise selection is a mix between forward and backward selection. We can either start with an empty model or a full model and add/remove predictors according some criteria. We will use the Akaike information criterion(AIC), which is defined as follows: AIC = 2k − 2max(log-likelihood) where k is the number of parameters in the model. Than we made Model diagnostics which mainly includes the following three aspects: 1) testing the proportional hazards(PH) assumption, 2) examining influential observations (or outliers), 3) detecting nonlinearity in relationship between the log hazard and the covariates. In order to check these model assumptions, Residuals method are used. The common residuals for the Cox model include:1) Schoenfeld residuals to check the proportional hazards assumption, 2) Martingale residual to assess nonlinearity, 3) Deviance residual (symmetric transformation of the Martinguale residuals), to examine influential observations [4]. Covariates conversion such as nonlinear transformations can be done if it is necessary. Finally, we use Concordance index(C-index) [5] to evaluate the effect of the model.
Parameters
- Basic parameters: Same as described in Multivariate Analyses.
- Direction: The mode of stepwise search, can be one of "none", "both", "backward", or "forward", with a default of "none".
- coxdiagnostics type: The type of residuals to present on Y axis of a diagnostic plot. The same as in residuals.coxph: character string indicating the type of residual desired. Possible values are "martingale", "deviance", "score", "schoenfeld", "dfbeta", "dfbetas" and "scaledsch".
- Validation Dataset: Selecting a Validation Set for Model Testing.
- formula: The variables contained in the model and their corresponding conversion formulas.
- variable transformation: Non-linear transformation of variables if necessary.
Result
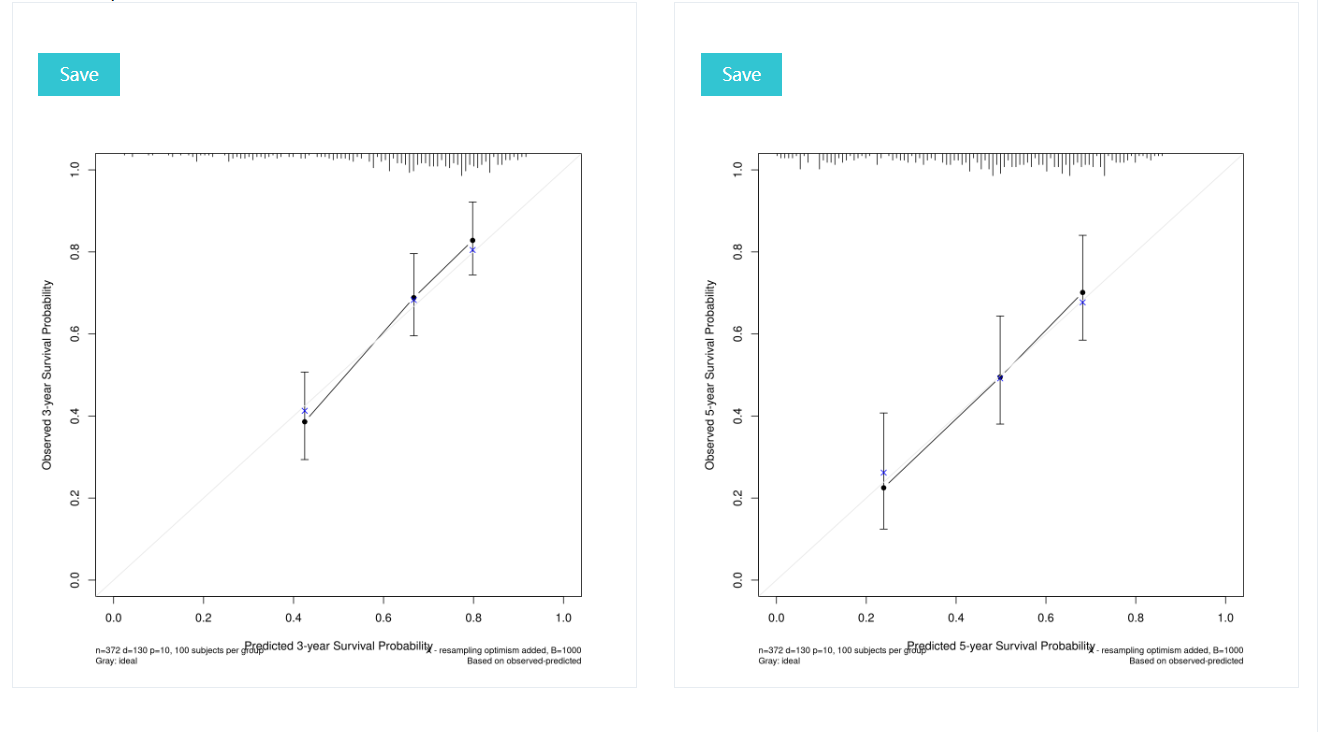
The three and five year calibration curve for prognostic model, the closer the curve is to the diagonal, the more accurate the model
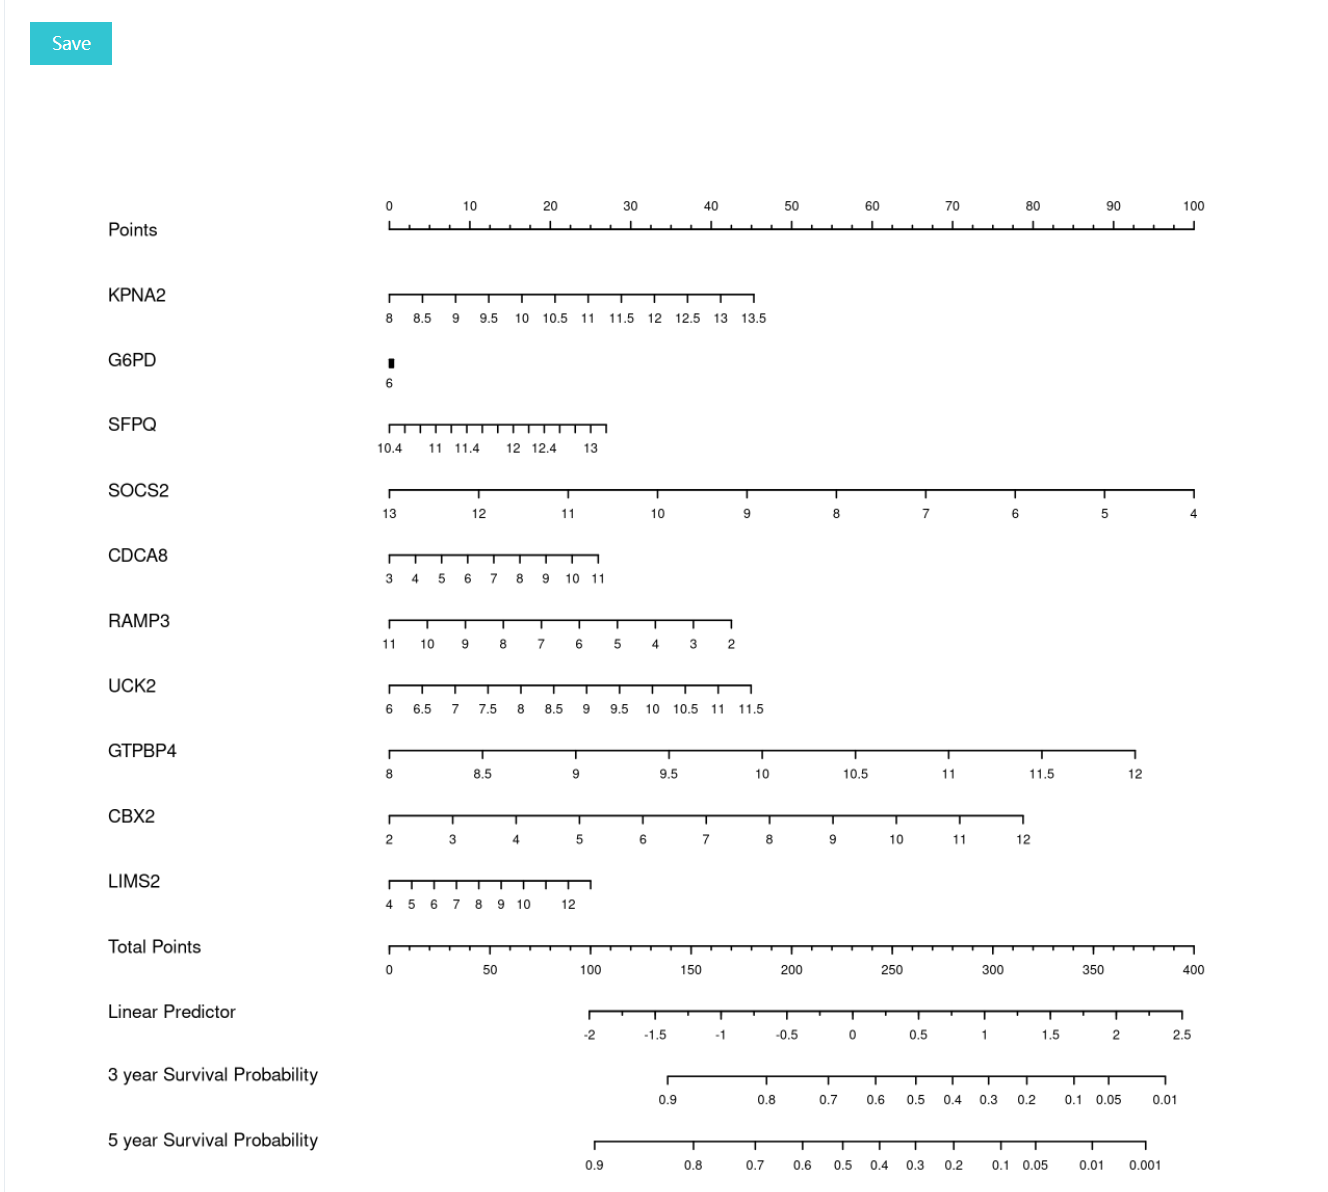
Nomogram for prognostic model,including the weight of each feature and three-year and five-year survival rates
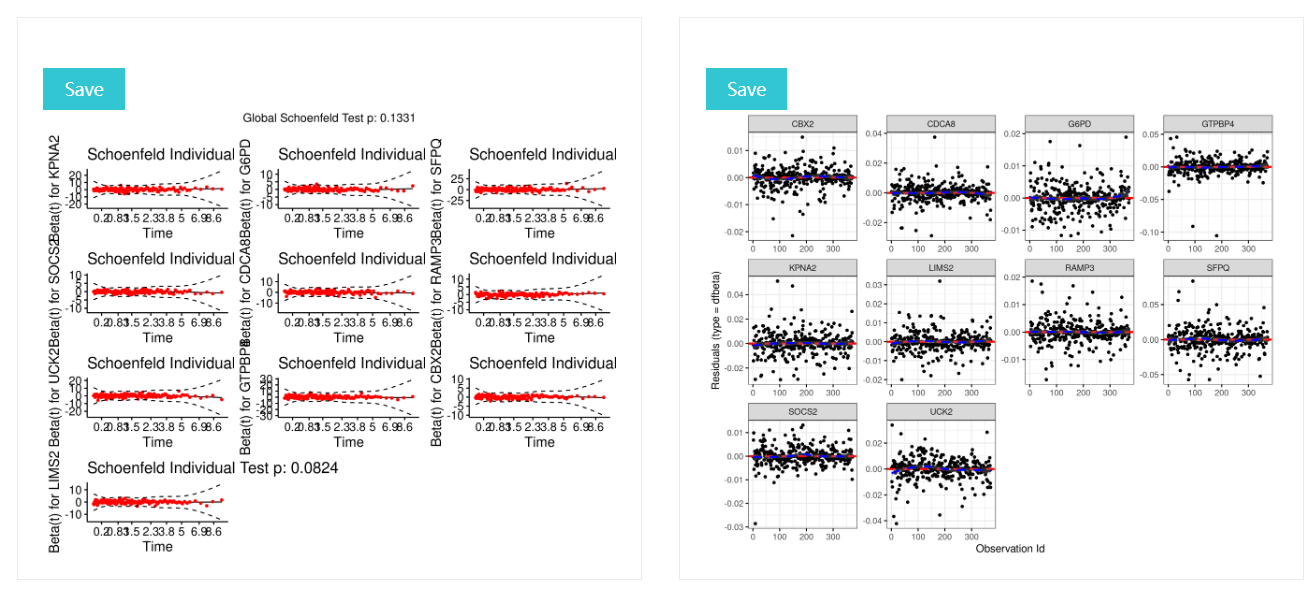
PH assumption test(right),and displays diagnostics graphs presenting goodness of Cox Proportional Hazards Model fit(left)
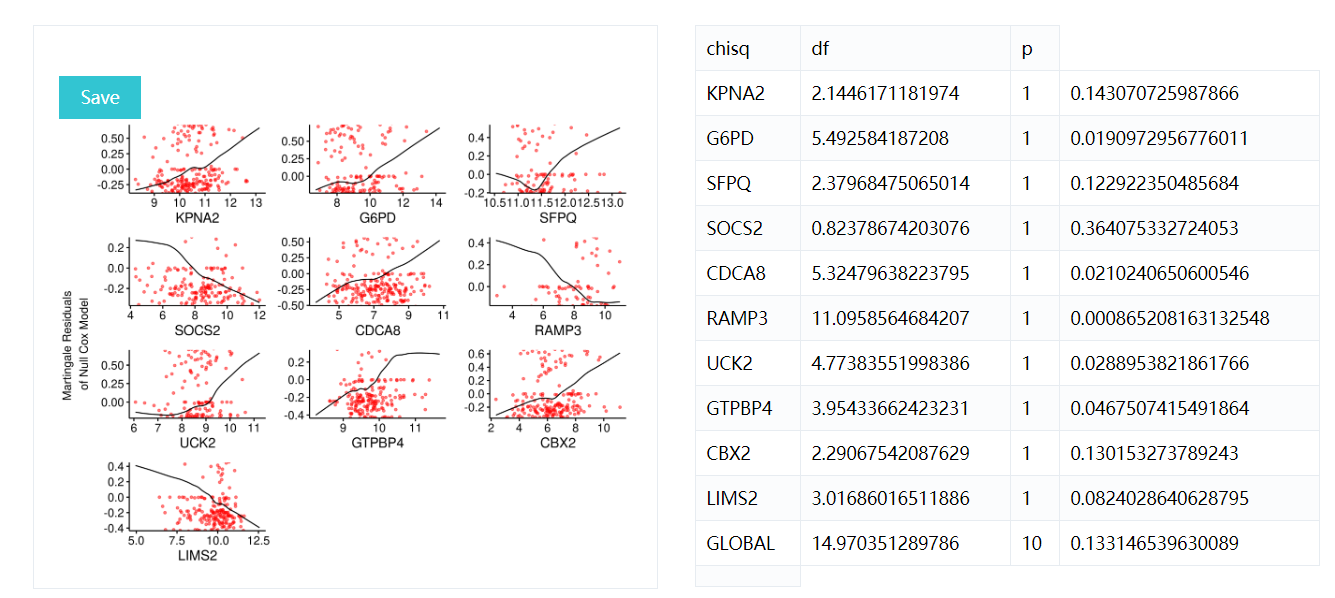
Displays graphs of continuous explanatory variable against martingale residuals of null cox proportional hazards model, for each term in of the right side of formula. This might help to properly choose the functional form of continuous variable in cox model (coxph). Fitted lines with lowess function should be linear to satisfy cox proportional hazards model assumptions.
Pan-cancer
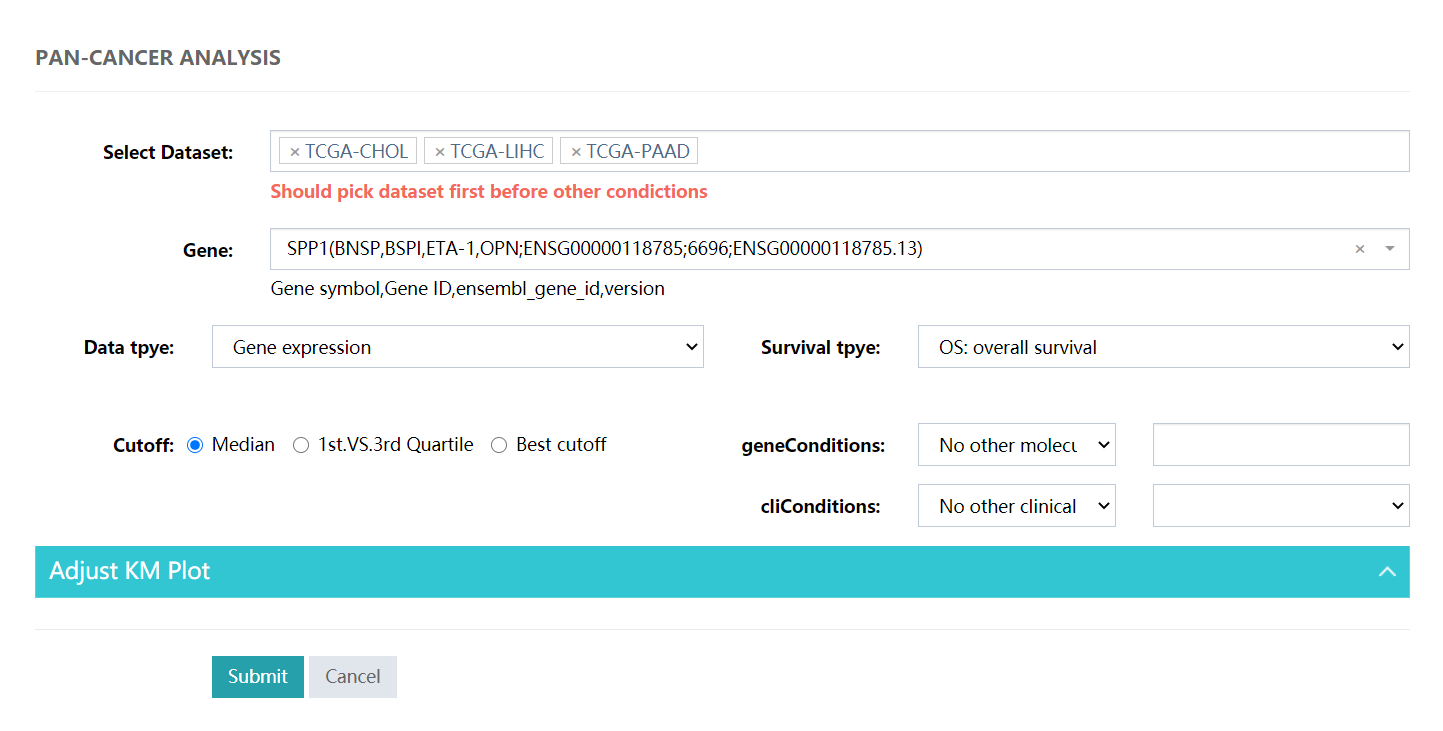
Pan-cancer Analysis was designed to investigate the prognostic effects of factors in a variety of tumors. All data were from the Pan-Cancer Atlas [6] with unified normalization and standardization. Users can select all type of cancer or just choose a subset of pan-cancer such as urologic (bladder urothelial carcinoma [BLCA], prostate adenocarcinoma [PRAD], testicular germ cell tumors [TGCT], kidney renal clear cell carcinoma [KIRC], kidney chromophobe [KICH], and kidney renal papillary cell carcinoma [KIRP]) which was designed by Pan-Cancer Atlas project. After that users can filtering subsets by conductions described in univariate module, besides ToPP set a somatic alterations (copy-number alterations, mutations, fusions or epigenetic silencing) in ten canonical pathways: cell cycle, Hippo, Myc, Notch, Nrf2, PI-3-Kinase/Akt, RTK-RAS, TGFb signaling, p53 and b-catenin/Wnt[7] as the pathway condition screening.
Parameters
- Select Dataset: Select the dataset, there are a total of 33 datasets here. See the attached table for more information.Users can select multiple types of datasets.
- Gene: Input a Gene symbol,Gene ID or ensembl_gene_id with fuzzy query.
- Data tpye: Select a certain omics data. Each dataset selected above may contain 8 types of omics data (Gene expression,lncRNA expression,miRNA expression,Somatic mutation,Protein expression,Methylation,Copy number variation,Gene fusion).
- Survival tpye: There are a total of five survival types to choose from: OS: overall survival, PFI: progression-free interval, DSS:disease-specific survival,DFI:disease-free interval and RFS:Relapse Free Survival.
- Cutoff: For continuous variables such gene or protein expression, variable will be divided into two groups by the median, quantile or the ‘best-cut’ value. Here, we calculated all the log-rank p value by the cut of each sample and keep at least 10% of samples for each group and the cut with the lowest p value was represented as the ‘best-cut’. While for categorical variable such mutation, CNA or gene fusion, variable will be divided into groups by the classification.
- geneConditions: Subgroup screening based on omics data,such as Somatic mutation,Methylation,Copy number variation and 10 canonical signaling pathway.
- cliConditions: Subgroup screening based on clinical data,such as gender,race,tumor stage,or disease-specific clinical features such as HER2+ in breast cancer.
- Draw designs: View a description of the parameters in the Univariate analysis.
Result
Typical pan-cancer analysis, for subgroup analysis please choose the Conditions or cliConditions selector.
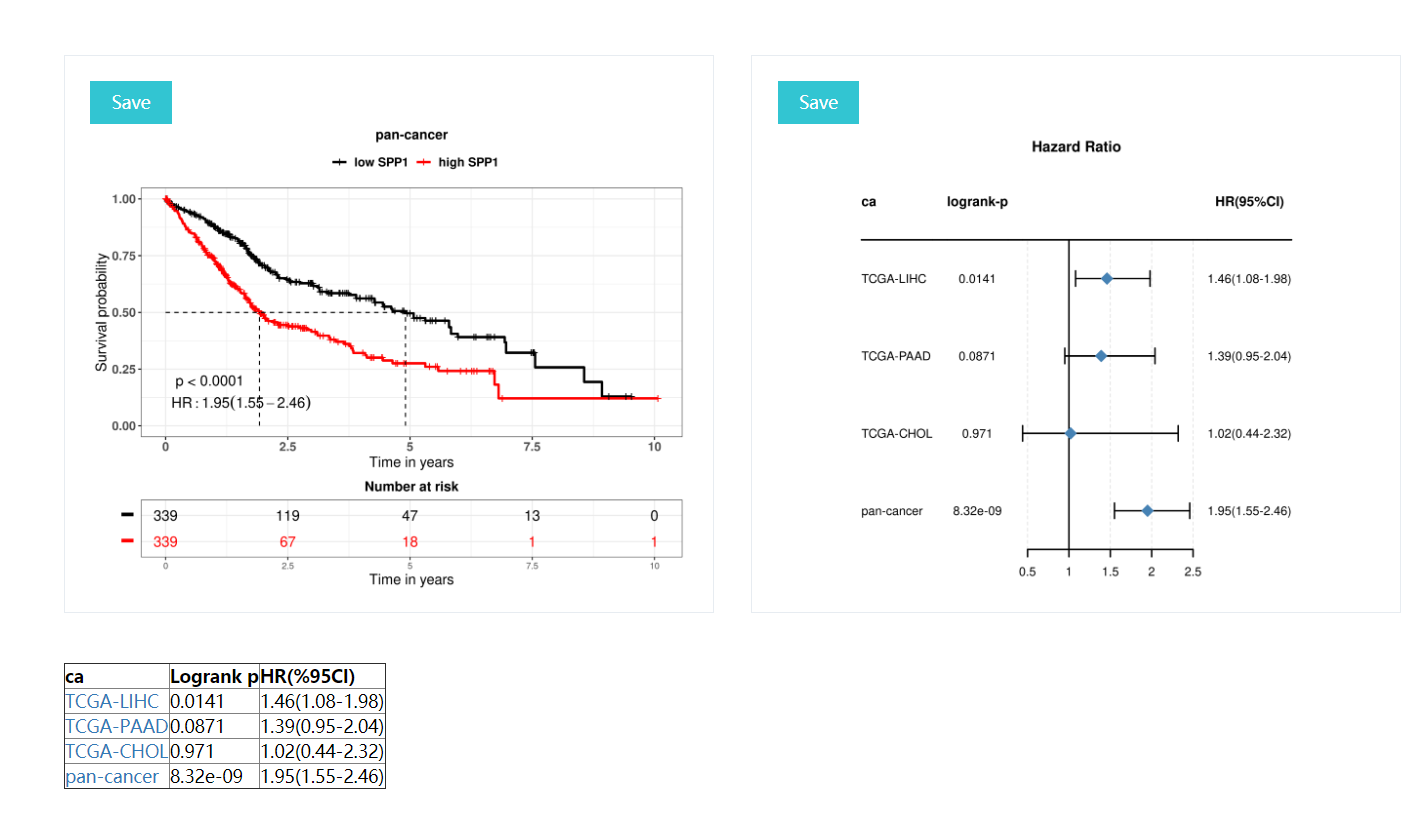
K-M curves: includeing p-values for the lograng test (p<0.05 was considered to be significantly different between the two groups),Hazards Ratio,risk table, description of the results, etc.
Forest plot:Meta-analysis of multiple tumors and pan-cancer,includeing lograng p value and HR(95%CI)
Combination Analysis
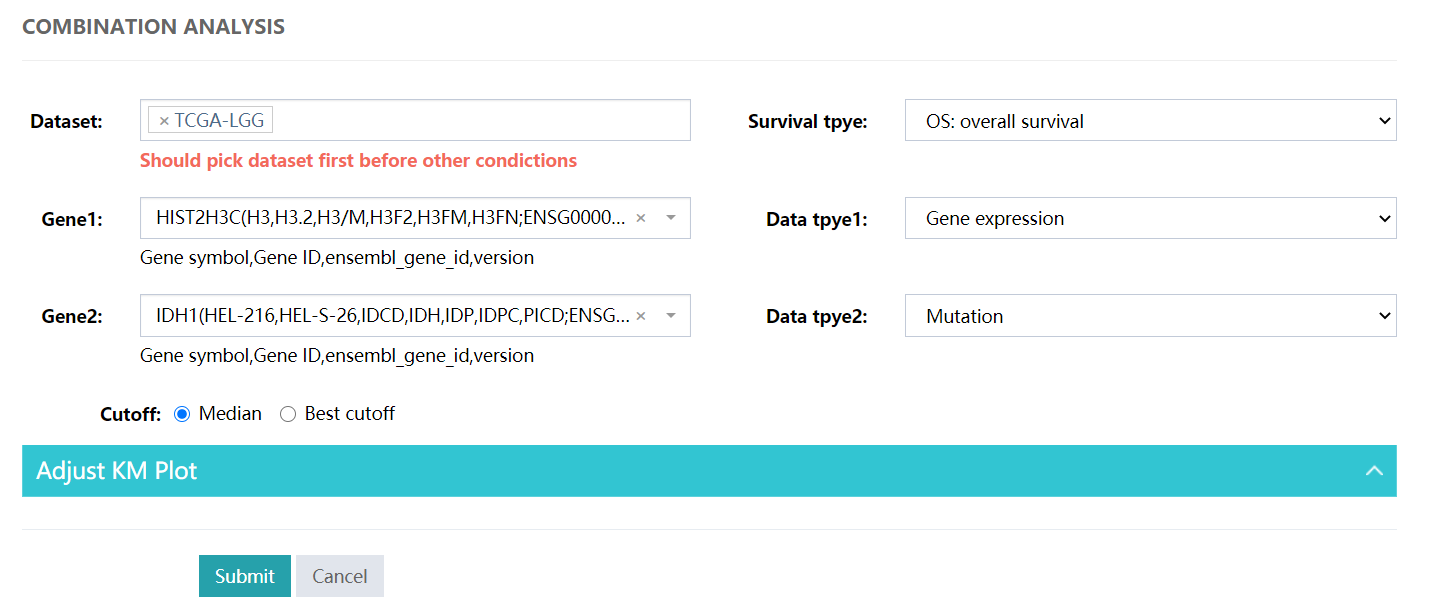
Combination analysis is to analyze the effect of the synergy of two factors on the prognosis. These two factors can be the same level of data such as the expression of two genes, or they can be different levels of data. For example, one is to check the effect of gene expression on prognosis, the other is to check the effect of gene mutation on prognosis. Then all the patients will be divided into 4 groups (high expression + mutation group, high expression + wild type group, low expression + mutation group and low expression + wild type) according to the threshold of two factors and log-rank test was performed to test whether there was significant difference between the two groups, separately. In this way, researchers can assess the synthetic lethality effects of two genes.
Parameters
Data selection
- Dataset: Select the dataset, there are a total of 33 datasets here. See the attached table for more information.
- Survival tpye: There are a total of five survival types to choose from: OS: overall survival, PFI: progression-free interval, DSS:disease-specific survival,DFI:disease-free interval and RFS:Relapse Free Survival.
- Gene1: Input a Gene symbol,Gene ID or ensembl_gene_id with fuzzy query.
- Data tpye1: Select a certain omics data. Each dataset selected above may contain 8 types of omics data (Gene expression,lncRNA expression,miRNA expression,Somatic mutation,Protein expression,Methylation,Copy number variation,Gene fusion).
- Gene2: Input another Gene symbol,Gene ID or ensembl_gene_id with fuzzy query.
- Data tpye2: Select another certain omics data. Each dataset selected above may contain 8 types of omics data (Gene expression,lncRNA expression,miRNA expression,Somatic mutation,Protein expression,Methylation,Copy number variation,Gene fusion).
- Cutoff: For continuous variables such gene or protein expression, variable will be divided into two groups by the median, quantile or the ‘best-cut’ value. Here, we calculated all the log-rank p value by the cut of each sample and keep at least 10% of samples for each group and the cut with the lowest p value was represented as the ‘best-cut’. While for categorical variable such mutation, CNA or gene fusion, variable will be divided into groups by the classification.
- Draw designs: View a description of the parameters in the Univariate analysis.
Result
Combination Analysis for multiple genes with multiple omics.
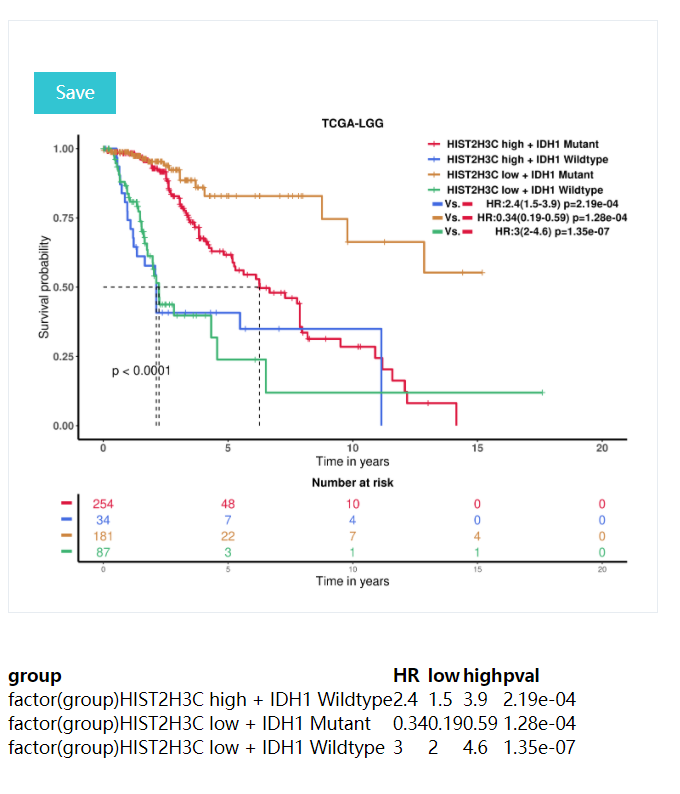
K-M curves: includeing p-values for the lograng test (p<0.05 was considered to be significantly different between the two groups),Hazards Ratio,risk table, description of the results, etc.
Upload Your Data
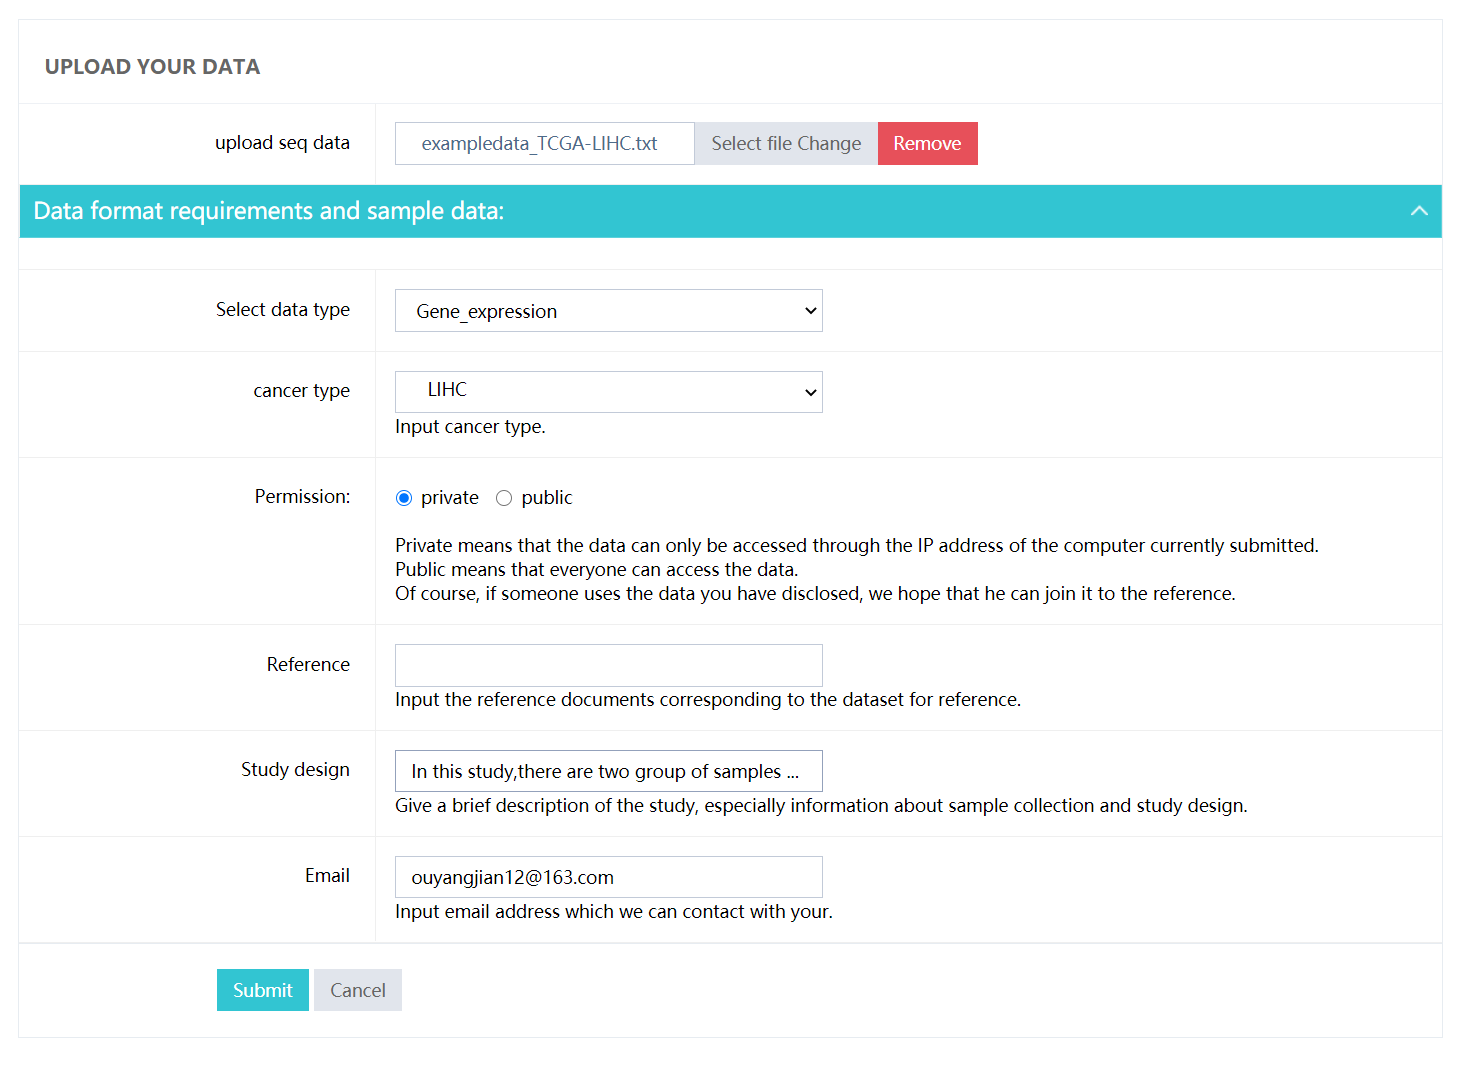
Data upload module allow users to upload their own data with survival time and status to do all kind of analysis in ToPP. Also user should set the permission for their own data and keep an email for connect if necessary.
Parameters
-
upload seq data:
Data format requirements: Example data can be downloaded here
Accept only data in TXT format and columns separate by \t;
Column names should be the survival state,survival time, gene symbol or clinical feature, rownames should be sample ID;
Column names of Survival state should be be in the "OS,PFI,DSS,DFI,RFS",Corresponding column names of survival time should be in the 'OS.time,PFI.time,DSS.time,DFI.time,RFS.time'.
The Survival state should be in 1 or 0 ,1:event occurrence,such as Death, recurrence, metastasis,censoring, etc. 0: event not occurrence such alive, no metastasis, etc;
The survival time should be in days.
Column names should contain "sample","group",while in group the tumor sample must be the same as file name,such as if your file is LIHC.txt,than the tumor patient in group column must be 'LIHC'
sample group cancer.type gender OS OS.time DSS DSS.time TP53 EGFR ERBB2 EZH2 TCGA.2V.A95S.01 TCGA-LIHC LIHC MALE 0 NA 0 NA 0 1.2 9.08 6.2 TCGA.2Y.A9GS.01 TCGA-LIHC LIHC MALE 1 724 1 724 0 2.57 8.03 2.5 TCGA.2Y.A9GT.01 TCGA-LIHC LIHC MALE 1 1624 1 1624 0 0 8.57 1.53 TCGA.2Y.A9GU.01 TCGA-LIHC LIHC FEMALE 0 1939 0 1939 2.77 1.42 8.82 0.56 TCGA.2Y.A9GV.01 TCGA-LIHC LIHC FEMALE 1 2532 1 2532 5.99 0.88 7.6 9.31 TCGA.2Y.A9GW.01 TCGA-LIHC LIHC MALE 1 1271 1 1271 0 0.82 8.33 8.95 TCGA.2Y.A9GY.01 TCGA-LIHC LIHC FEMALE 1 757 1 757 0 0 8.4 8.59 TCGA.2Y.A9GZ.01 TCGA-LIHC LIHC FEMALE 1 848 1 848 7.41 6.1 8.74 9.22 TCGA.2Y.A9H0.11 normal LIHC MALE 0 3675 0 3675 0 0 7.65 8.86 - Select data type: Select a certain omics data. Each dataset selected above may contain 8 types of omics data (Gene expression,lncRNA expression,miRNA expression,Somatic mutation,Protein expression,Methylation,Copy number variation,Gene fusion).
- cancer type: Select cancer type for your study .
- Permission: Private means that the data can only be accessed through the IP address of the computer currently submitted. Public means that everyone can access the data. Of course, if someone uses the data you have public, we hope that he can join it to the reference.
- Reference: Input the reference documents corresponding to the dataset for reference.
- Study design: Give a brief description of the study, especially information about sample collection and study design.
- Email: Input email address which we can contact with your.
Result
Supplemental table
Supplemental table for all the cancer type and the data type.
| ID | Genome | Transcriptome | Proteome | Epigenome | Clinical data | |||||||
|---|---|---|---|---|---|---|---|---|---|---|---|---|
| ID | Project | 中文名称 | Mutation | CNA | Fusion | mRNA | miRNA | LncRNA | RPPA | MS | Methylation | Phenotype |
| TCGA-ACC | Adrenocortical carcinoma | 肾上腺皮质癌 | √ | √ | √ | √ | √ | NA | √ | NA | √ | √ |
| TCGA-BLCA | Bladder Urothelial Carcinoma | 膀胱尿路上皮癌 | √ | √ | √ | √ | √ | √ | √ | NA | √ | √ |
| TCGA-BRCA | Breast invasive carcinoma | 乳腺浸润癌 | √ | √ | √ | √ | √ | √ | √ | √ | √ | √ |
| TCGA-CESC | Cervical squamous cell carcinoma and endocervical adenocarcinoma | 宫颈鳞癌和腺癌 | √ | √ | √ | √ | √ | √ | √ | NA | √ | √ |
| TCGA-CHOL | Cholangiocarcinoma | 胆管癌 | √ | √ | √ | √ | √ | NA | √ | NA | √ | √ |
| TCGA-COAD | Colon adenocarcinoma | 结肠癌 | √ | √ | √ | √ | √ | √ | √ | √ | √ | √ |
| TCGA-DLBC | Lymphoid Neoplasm Diffuse Large B-cell Lymphoma | 弥漫性大B细胞淋巴瘤 | √ | √ | √ | √ | √ | NA | √ | NA | √ | √ |
| TCGA-ESCA | Esophageal carcinoma | 食管癌 | √ | √ | √ | √ | √ | NA | √ | NA | √ | √ |
| TCGA-GBM | Glioblastoma multiforme | 多形成性胶质细胞瘤 | √ | √ | √ | √ | √ | √ | √ | NA | √ | √ |
| TCGA-HNSC | Head and Neck squamous cell carcinoma | 头颈鳞状细胞癌 | √ | √ | √ | √ | √ | √ | √ | NA | √ | √ |
| TCGA-KICH | Kidney Chromophobe | 肾嫌色细胞癌 | √ | √ | √ | √ | √ | √ | √ | NA | √ | √ |
| TCGA-KIRC | Kidney renal clear cell carcinoma | 肾透明细胞癌 | √ | √ | √ | √ | √ | √ | √ | NA | √ | √ |
| TCGA-KIRP | Kidney renal papillary cell carcinoma | 肾乳头状细胞癌 | √ | √ | √ | √ | √ | √ | √ | NA | √ | √ |
| TCGA-LAML | Acute Myeloid Leukemia | 急性髓细胞样白血病 | √ | √ | √ | √ | √ | NA | NA | NA | √ | √ |
| TCGA-LGG | Brain Lower Grade Glioma | 脑低级别胶质瘤 | √ | √ | √ | √ | √ | √ | √ | NA | √ | √ |
| TCGA-LIHC | Liver hepatocellular carcinoma | 肝细胞肝癌 | √ | √ | √ | √ | √ | √ | √ | NA | √ | √ |
| TCGA-LUAD | Lung adenocarcinoma | 肺腺癌 | √ | √ | √ | √ | √ | √ | √ | NA | √ | √ |
| TCGA-LUSC | Lung squamous cell carcinoma | 肺鳞癌 | √ | √ | √ | √ | √ | √ | √ | NA | √ | √ |
| TCGA-MESO | Mesothelioma | 间皮瘤 | √ | √ | √ | √ | √ | NA | √ | NA | √ | √ |
| TCGA-OV | Ovarian serous cystadenocarcinoma | 卵巢浆液性囊腺癌 | √ | √ | √ | √ | √ | √ | √ | √ | √ | √ |
| TCGA-PAAD | Pancreatic adenocarcinoma | 胰腺癌 | √ | √ | √ | √ | √ | NA | √ | NA | √ | √ |
| TCGA-PCPG | Pheochromocytoma and Paraganglioma | 嗜铬细胞瘤和副神经节瘤 | √ | √ | √ | √ | √ | NA | √ | NA | √ | √ |
| TCGA-PRAD | Prostate adenocarcinoma | 前列腺癌 | √ | √ | √ | √ | √ | √ | √ | NA | √ | √ |
| TCGA-READ | Rectum adenocarcinoma | 直肠腺癌 | √ | √ | √ | √ | √ | √ | √ | √ | √ | √ |
| TCGA-SARC | Sarcoma | 肉瘤 | √ | √ | √ | √ | √ | NA | √ | NA | √ | √ |
| TCGA-SKCM | Skin Cutaneous Melanoma | 皮肤黑色素瘤 | √ | √ | √ | √ | √ | √ | √ | NA | √ | √ |
| TCGA-STAD | Stomach adenocarcinoma | 胃癌 | √ | √ | √ | √ | √ | √ | √ | NA | √ | √ |
| TCGA-TGCT | Testicular Germ Cell Tumors | 睾丸癌 | √ | √ | √ | √ | √ | NA | √ | NA | √ | √ |
| TCGA-THCA | Thyroid carcinoma | 甲状腺癌 | √ | √ | √ | √ | √ | √ | √ | NA | √ | √ |
| TCGA-THYM | Thymoma | 胸腺癌 | √ | √ | √ | √ | √ | NA | √ | NA | √ | √ |
| TCGA-UCEC | Uterine Corpus Endometrial Carcinoma | 子宫内膜癌 | √ | √ | √ | √ | √ | √ | √ | NA | √ | √ |
| TCGA-UCS | Uterine Carcinosarcoma | 子宫肉瘤 | √ | √ | √ | √ | √ | NA | √ | NA | √ | √ |
| TCGA-UVM | Uveal Melanoma | 葡萄膜黑色素瘤 | √ | √ | √ | √ | √ | NA | √ | NA | √ | √ |
Reference
[1]. Kleinbaum D G, Klein M. Kaplan-Meier survival curves and the log-rank test[M]//Survival analysis. Springer, New York, NY, 2012: 55-96.
[2]. Christensen E. Multivariate survival analysis using Cox's regression model[J]. Hepatology, 1987, 7(6): 1346-1358.
[3]. The Cox model in R Gardar Sveinbjornsson, Jongkil Kim, Yongsheng Wang April 18, 2011
[4]. Xue Y, Schifano E D. Diagnostics for the Cox model[J]. Communications for Statistical Applications and Methods, 2017, 24(6): 583-604.
[5]. Harrell Jr F E, Lee K L, Mark D B. Multivariable prognostic models: issues in developing models, evaluating assumptions and adequacy, and measuring and reducing errors[J]. Statistics in medicine, 1996, 15(4): 361-387.
[6]. Hoadley K A, Yau C, Hinoue T, et al. Cell-of-origin patterns dominate the molecular classification of 10,000 tumors from 33 types of cancer[J]. Cell, 2018, 173(2): 291-304. e6.
[7]. Sanchez-Vega F, Mina M, Armenia J, et al. Oncogenic signaling pathways in the cancer genome atlas[J]. Cell, 2018, 173(2): 321-337. e10.